Debugging
Various debugging tools and strategies
Web-client Performance
Find performance problems Chrome's Devtools. Condensed from Debugging React performance with React 16 and Chrome Devtools
Setup
Requirements:
- Export your JS with source-maps (recommended)
- Google Chrome or Chromium’s Dev Tool
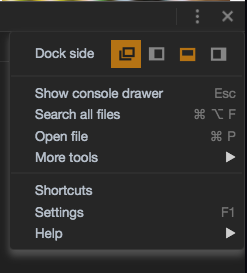
Might also want to undock devtools to get some real estate going:
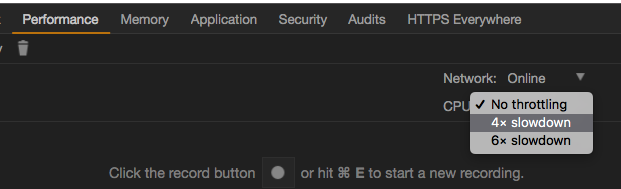
Throttle CPU by 4x or 6x in the performance tab:
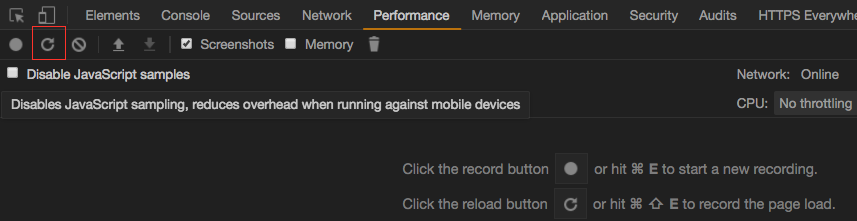
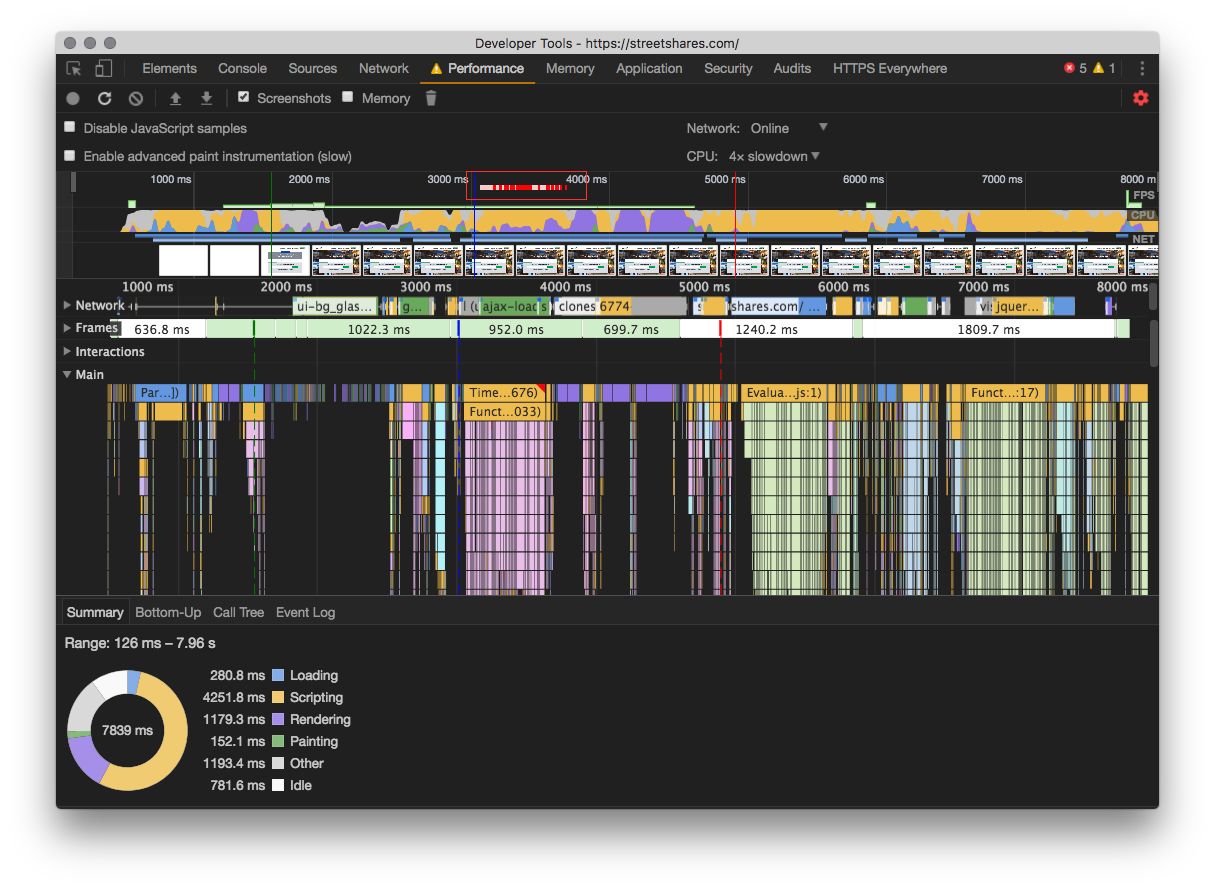
Running a trace
Hit the reload button. This will record a performance trace for the current page. Chrome will automatically stop recording the trace after the page has settled.
Identify problem areas
This red bar indicator shows that there is some significant ‘CPU burn’ (long tasks) around this part of the trace timeline. Good place to start investigating.
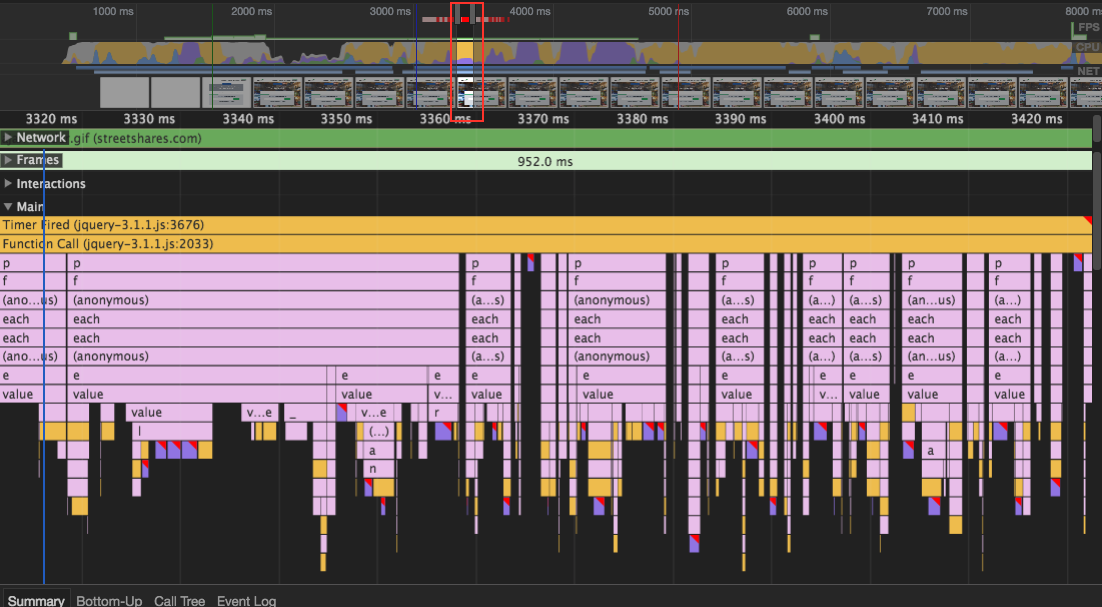
Investigating problem areas
Select a section of the timeline to isolate a red CPU burn section. Scrolling up and down also works to zoom around the graph:
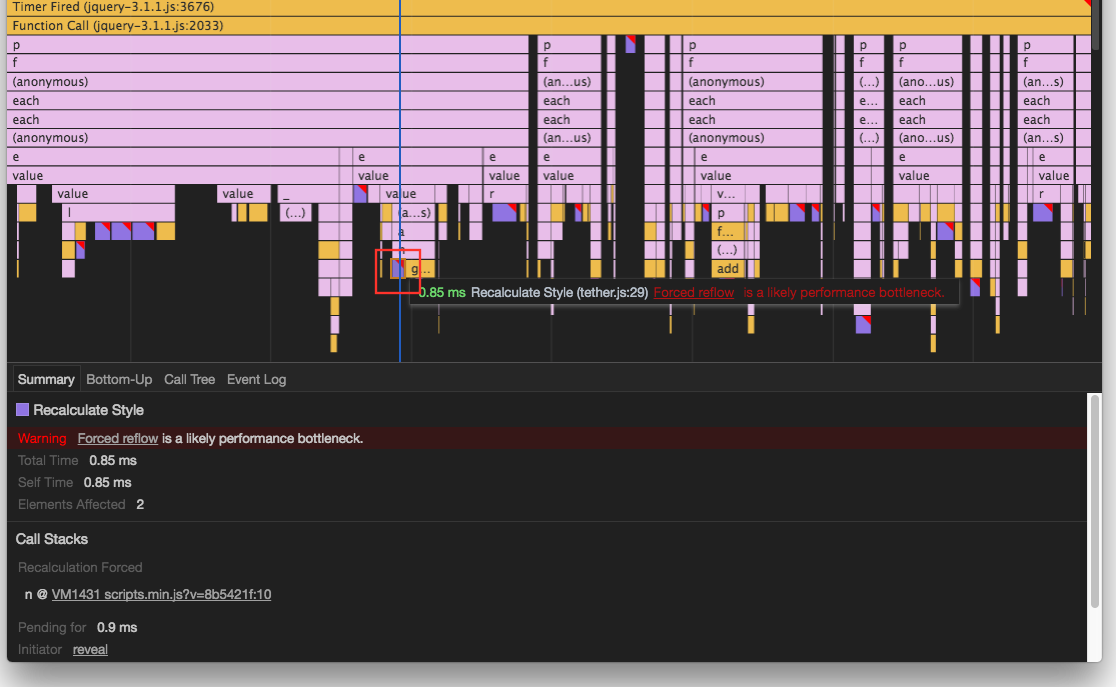
Discovering slow functions
Select a node that has a red corner:
Go to problematic code
Click the "Bottom-Up" tab to get the call stack and code line numbers:
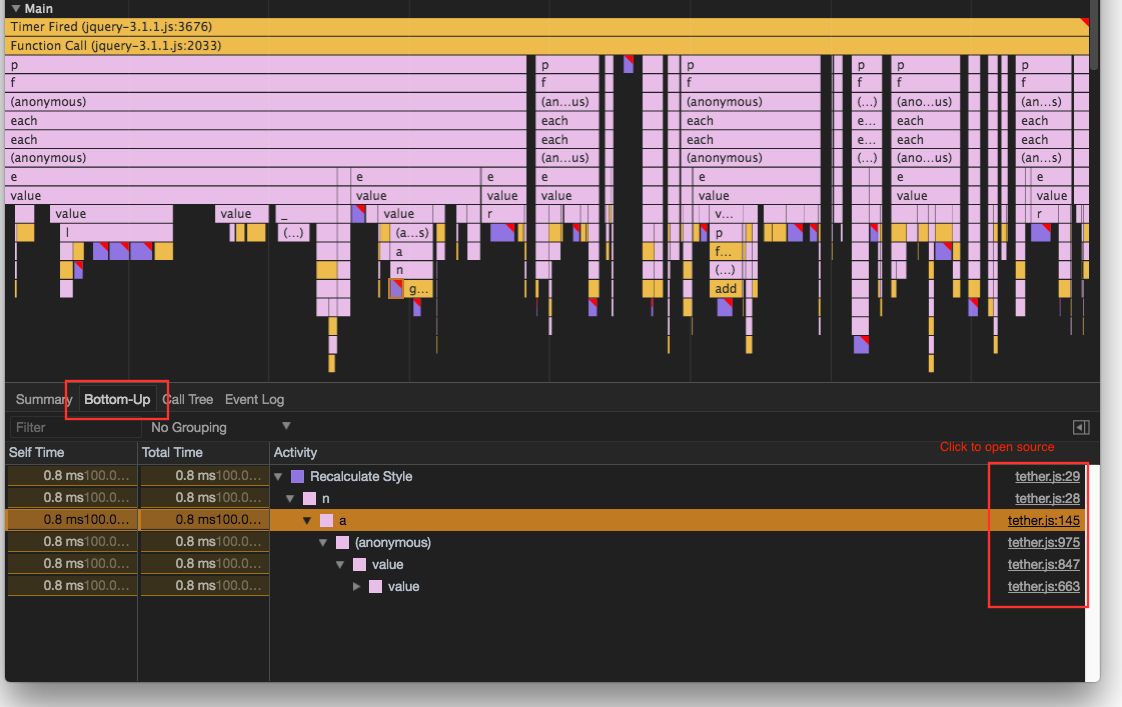
Click on a line number to open the js file: